
1
Please refer to important disclosures at the end of this report
1
1
Angel Top Picks – February 2019
Market largely stayed stable in the month of January after witnessing a severe
pain in the previous few months as the crude oil price fell from the peak and the
rupee also showed decent appreciation. Our top picks have generated a total
return of 49% since inception (i.e. October 2015), an outperformance of 13.3%
over BSE100.
Recent budget to boost consumption – After the loss of the ruling centre party in
the 3 state elections, the market were looking concerned about the former win in
the centre election happening in May 2019. However, the recently announced
budget contained measures like direct cash transfer to farmers and the other
taxation sops, which will boost the consumption in the economy, especially from
the middle class. Moreover, the fiscal deficit target at 3.4% as a % of GDP for
FY2019 was also in line with the market expectations. For FY2020 also, the fiscal
deficit target is at reasonable 3.4% which includes ` 75000 crore allocation for the
Income Support Scheme (PMKISAN) to farmers.
Next few months could offer some good investment opportunities- We continue to
believe that the market may be in wait and watch mode till centre election. We feel
that the markets are still factoring in the current ruling party’s in the upcoming
centre election and hence, any unfavorable results for the ruling centre party could
draw a sharp negative reaction from the markets. However, this period could also
offer opportunities to cherry pick some quality equity investment. We prefer select
private banks and niche consumption stocks. Investors could also pick at the some
of the overly corrected value stocks which offer high margin of safety. We also
advise our investors to avoid bottom fishing stocks which are facing severe
corporate governance/ regulatory issues.
Top picks’ overview
We recommend our top picks as the good bets to utilize this opportunity which are
offering healthy returns in the next 1 year. All of our top picks are backed by sound
business model and are likely to do well in coming years. We remain overweight
on discretionary consumption theme with stocks like Safari Industries, TTK Prestige,
Bata, and Blue Star.
Exhibit 1: Top-Picks Performance
Return Since Inception (30th Oct, 2015)
Top Picks Return
49.0%
BSE 100
35.7%
Outperformance
13.3%
Source: Company, Angel Research
Top Picks
Company
CMP (`)
TP (`)
Banking/NBFC
Aditya Birla Capital
81
151
GIC Housing Finance
243
424
ICICI Bank
355
416
HDFC Bank
2,092
2,500
RBL Bank
578
690
Shriram Transport Finance
1,044
1,764
Consumption
Amber Enterprises
727
1,135
Bata India
1,144
1,243
Blue Star
603
867
Safari Industries
776
1,000
Siyaram Silk Mills
340
606
Parag Milk Foods
205
330
TTK Prestige
7,705
8,200
Media/Automobiles/Online
Maruti Suzuki
6,957
10,820
M&M
688
1,050
Music Broadcast
299
475
Ashok Leyland
84
156
Real Estate/Infra/Logistics/Power
Jindal Steel
130
250
GMM Pfaudler
1,096
1,200
KEI Industries
368
486
Inox Wind
70
120
Pharmaceuticals
Aurobindo Pharmaceuticals
799
890
Source: Angel Research;
Note: CMP as of 02 February, 2019

2
Error!
Refer
ence
sourc
Angel Top Picks | February 2019
February 5, 2019
2
Top Picks
3
Error!
Refer
ence
sourc
Angel Top Picks | February 2019
February 5, 2019
3
Ashok Leyland
During April-July 2018, Ashok Leyland has gained market share by 11bps in
domestic market. Further, the company has reported ~46.4% yoy growth
(against ~45% industry growth) during the same period due to strong pick up
in construction and industrial activities.
BS-VI emission norms and the vehicle scrappage policy are among the major
triggers that can provide a fillip to the commercial vehicle industry over the
next couple of years. Further, in our view, the change in axle load norms will
not impact the CV demand scenario; hence the company will not witness any
disruption in performance.
In the recent past, the stock has corrected ~30% after the announcement of
axle load norms (which will not have a significant impact on the industry). We
see buying opportunity in stock.
Key Financials
Y/E
Sales
OPM
PAT
EPS
ROE
P/E
P/BV
EV/Sales
March
(` cr)
(%)
(` cr)
(`)
(%)
(x)
(x)
(x)
FY2019E
32,042
10.3
1,918
6.6
22.8
12.8
2.9
0.6
FY2020E
37,488
10.5
2,303
7.9
23.0
10.7
2.5
0.5
Source: Company, Angel Research
Safari Industries
Safari Industries Ltd (Safari) is the third largest branded player in the Indian
luggage industry. Post the management change in 2012, Safari has grown
its revenue by 6x in the last 7 years. This has been achieved by foraying in
many new categories like back pack, school bags ( via acquisition of
Genius and Genie) and improvement in distribution networks.
Its margins have more than doubled from 4.1% in FY2014 to 9.1% in
M9FY2018, driven by launch of new product categories and business. We
expect it to maintain 9%+ margins from FY2018 onwards led by regular price
hikes, shift towards organized player and favorable industry dynamics.
We expect its revenue to grow by a CAGR of ~30%/60% in revenue/ earnings
over FY2018-20E on the back of growth in its recently introduced new
products.
Key Financials
Y/E
Sales
OPM
PAT
EPS
ROE
P/E
P/BV
EV/Sales
March
(` cr)
(%)
(` cr)
(`)
(%)
(x)
(x)
(x)
FY2019E
540.0
12.9
40.8
18.3
19.4
42.3
7.9
3.2
FY2020E
702.0
12.9
54.6
24.5
21.0
31.6
6.4
2.5
Source: Company, Angel Research
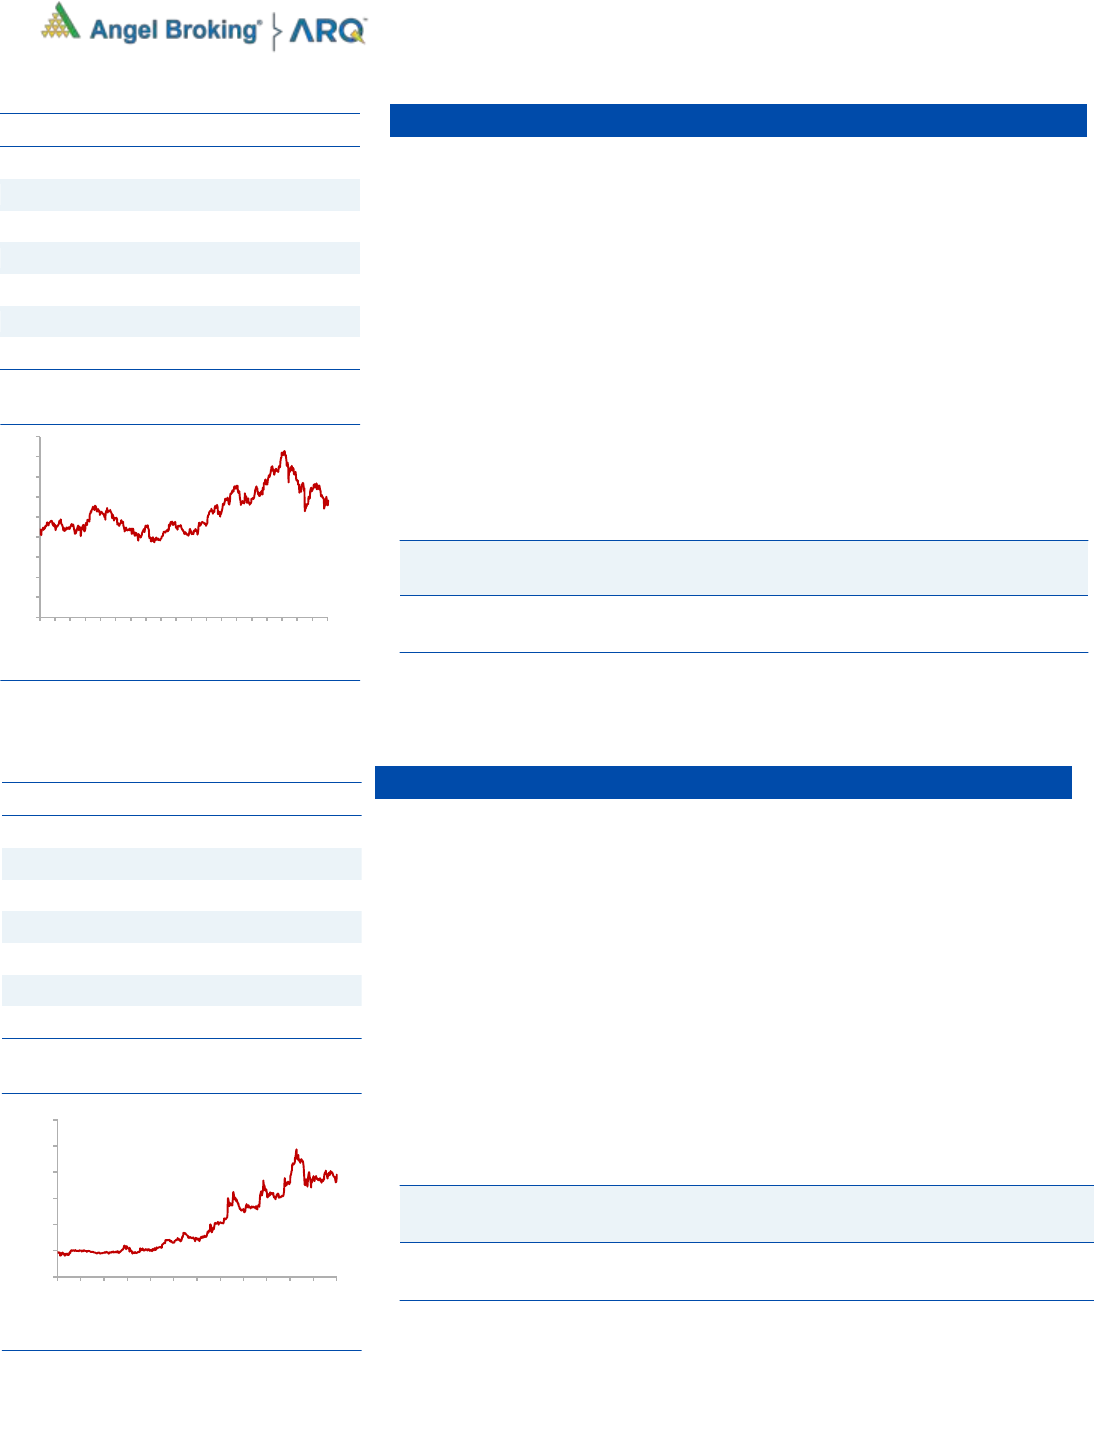
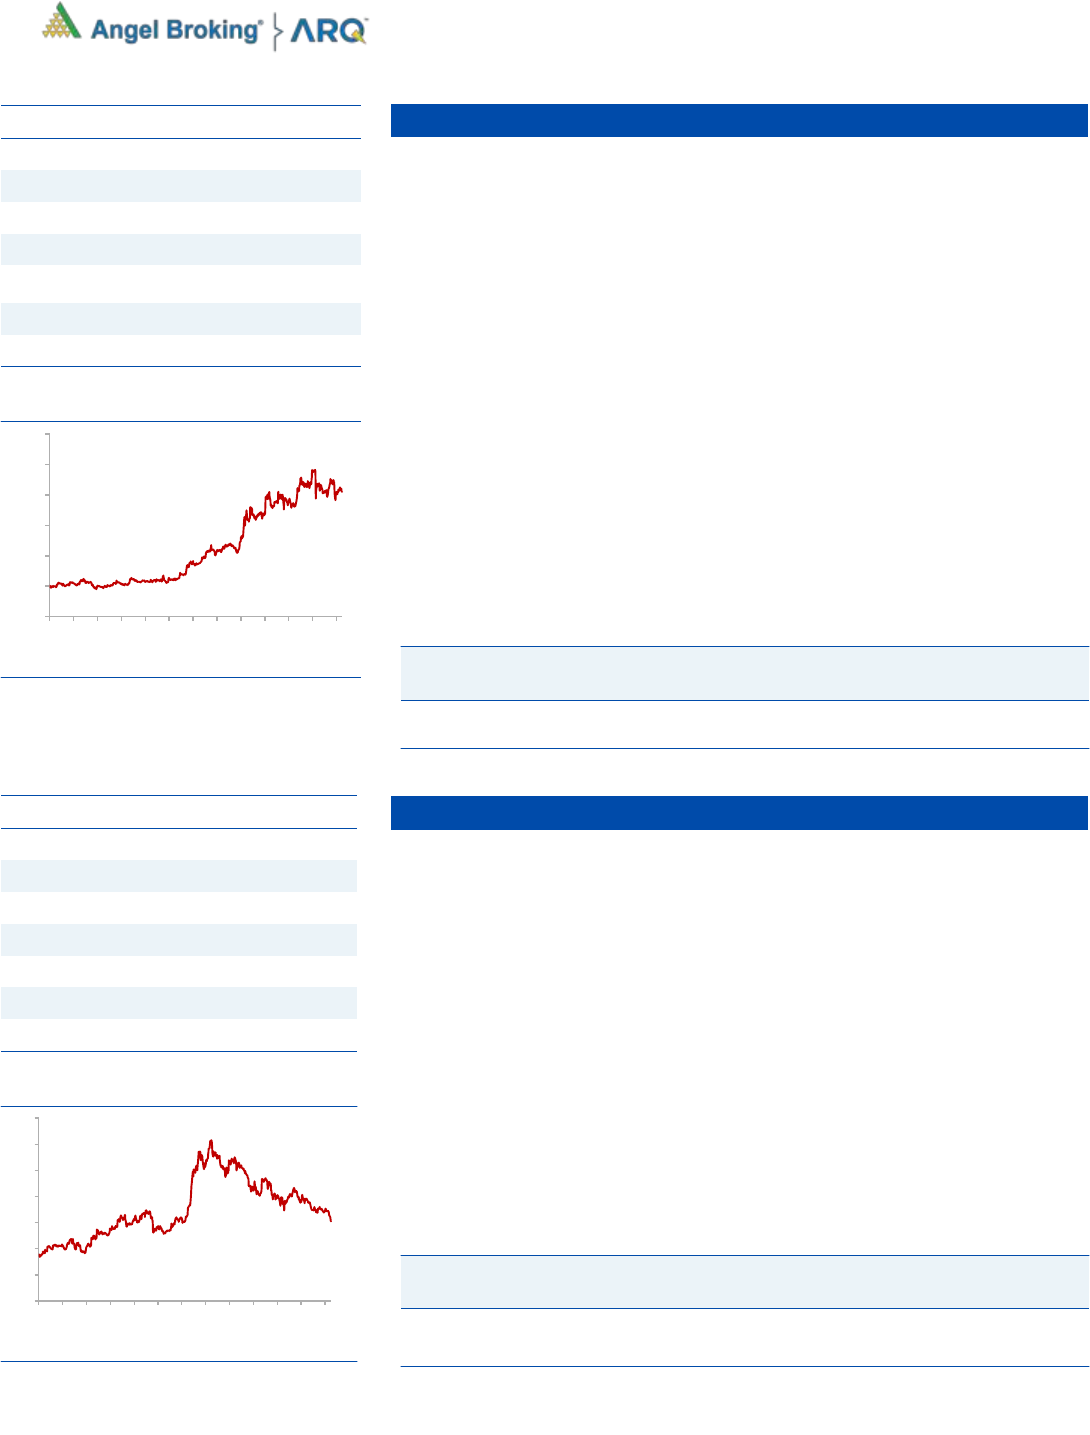
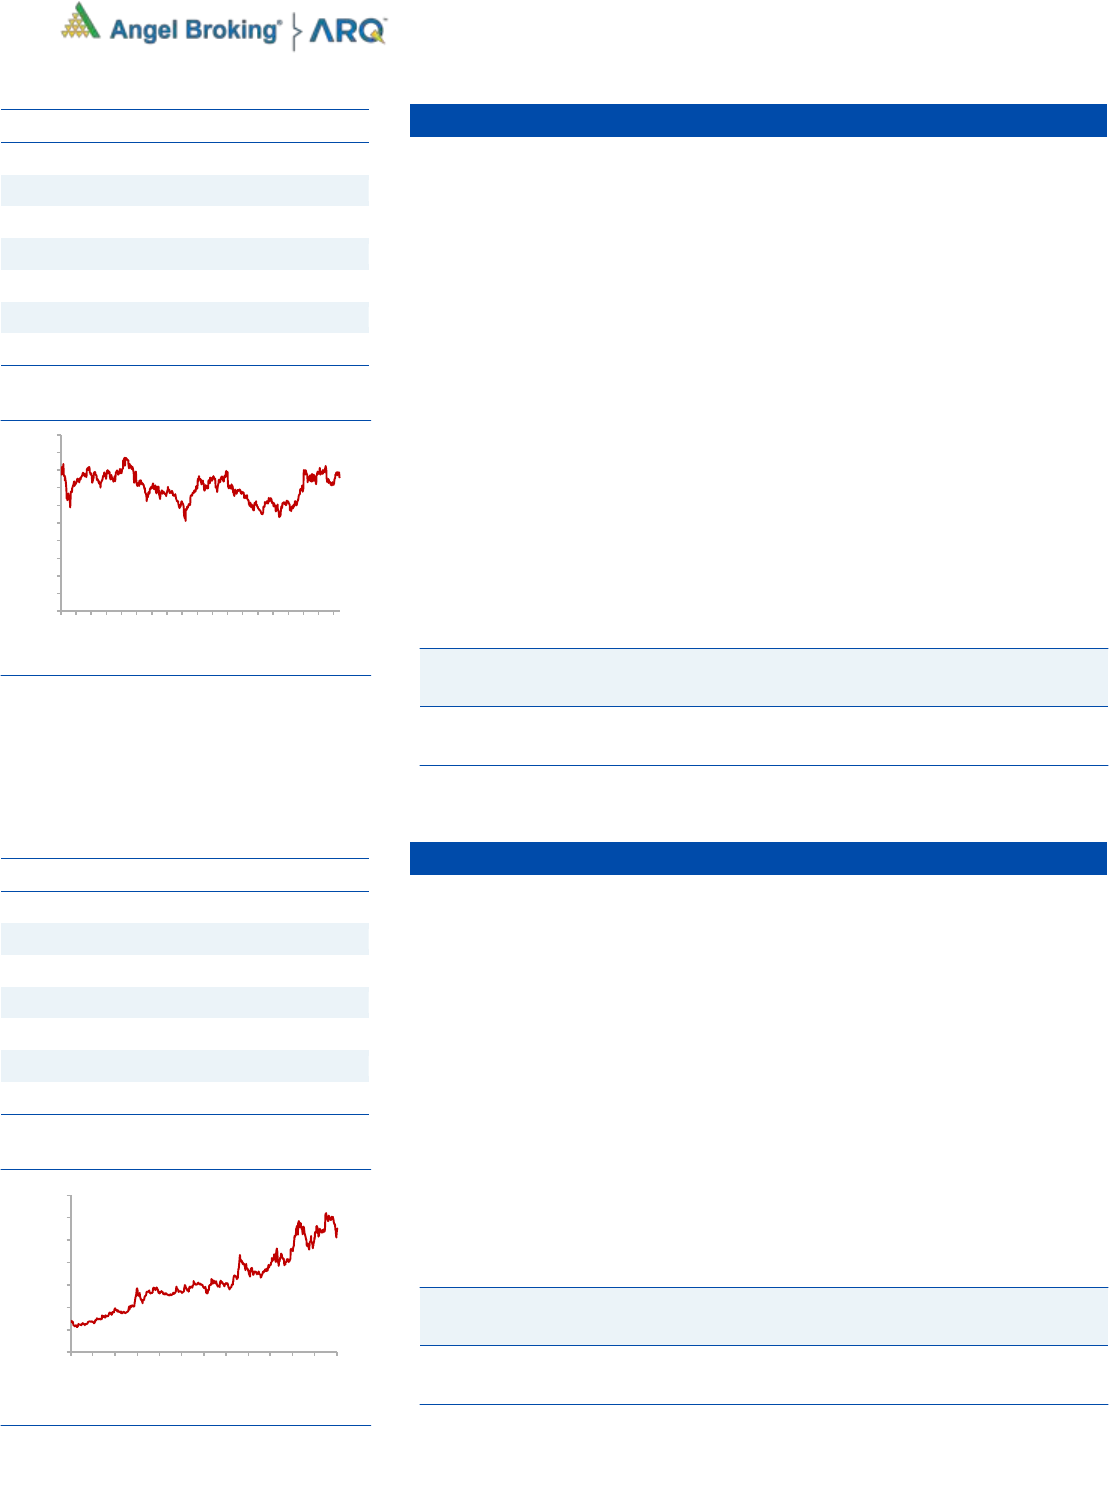
Stock Info
CMP
84
TP
156
Upside
85.7%
Sector
Financials
Market Cap (` cr)
24,462
Beta
1.6
52 Week High / Low
167/ 79
3 year-Chart
Source: Company, Angel Research
-
20
40
60
80
100
120
140
160
180
Dec-15
Feb-16
Apr-16
Jun-16
Aug-16
Oct-16
Dec-16
Feb-17
Apr-17
Jun-17
Aug-17
Oct-17
Dec-17
Feb-18
Apr-18
Jun-18
Aug-18
Oct-18
Dec-18
Jan-19
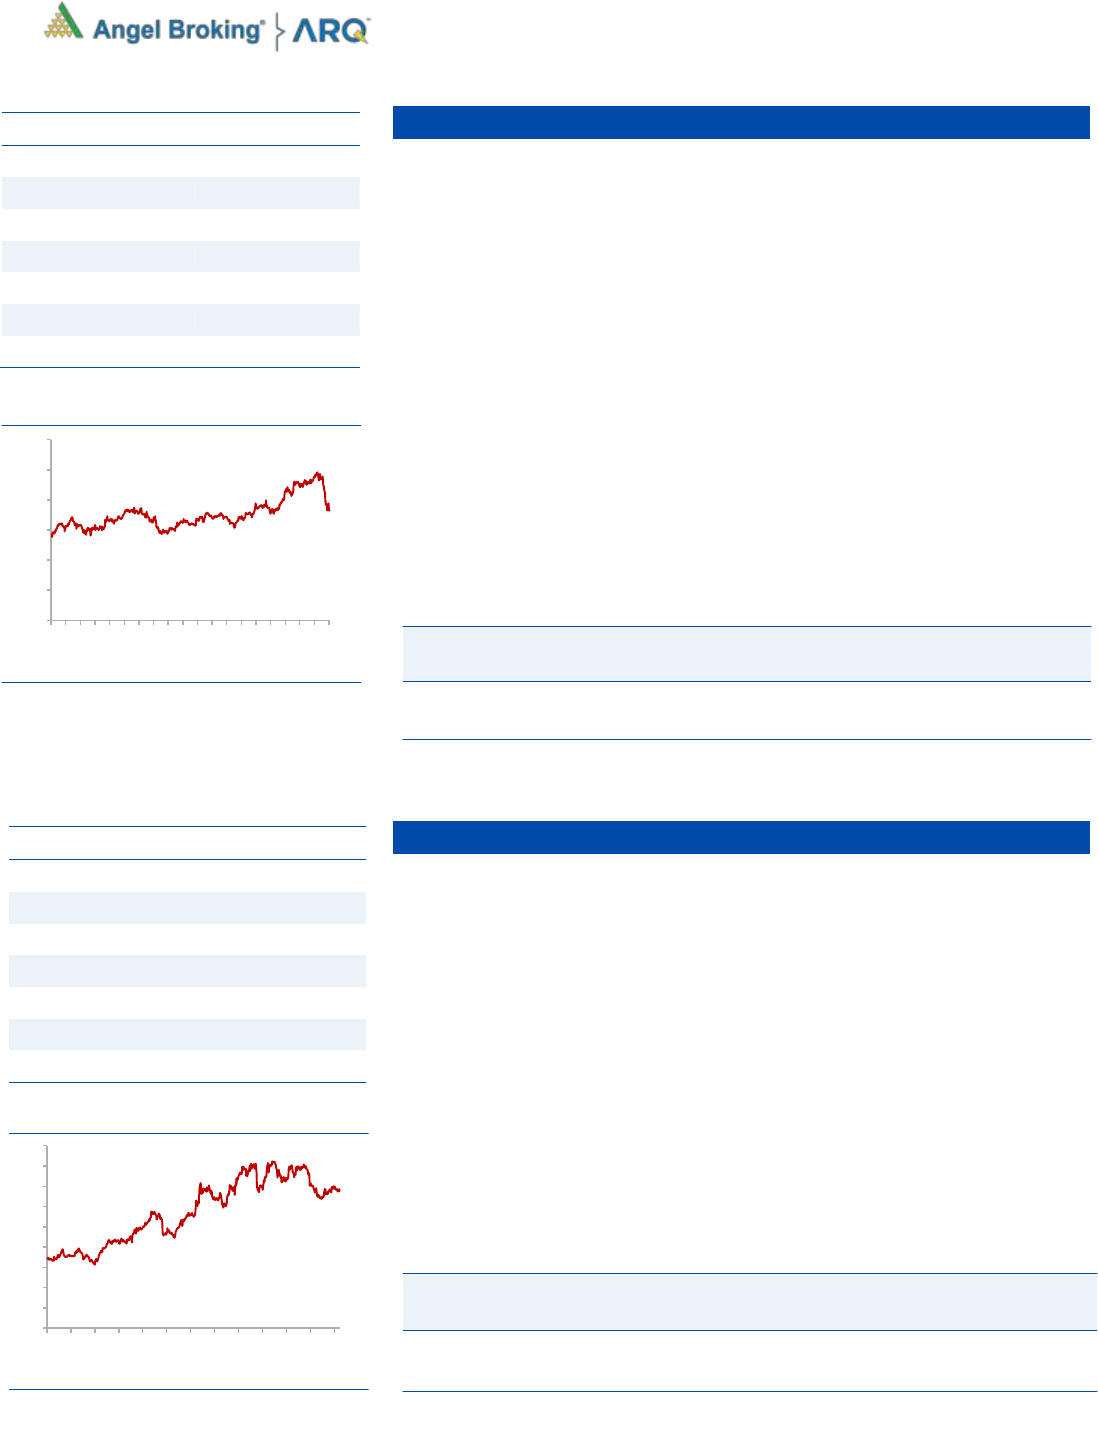
Stock Info
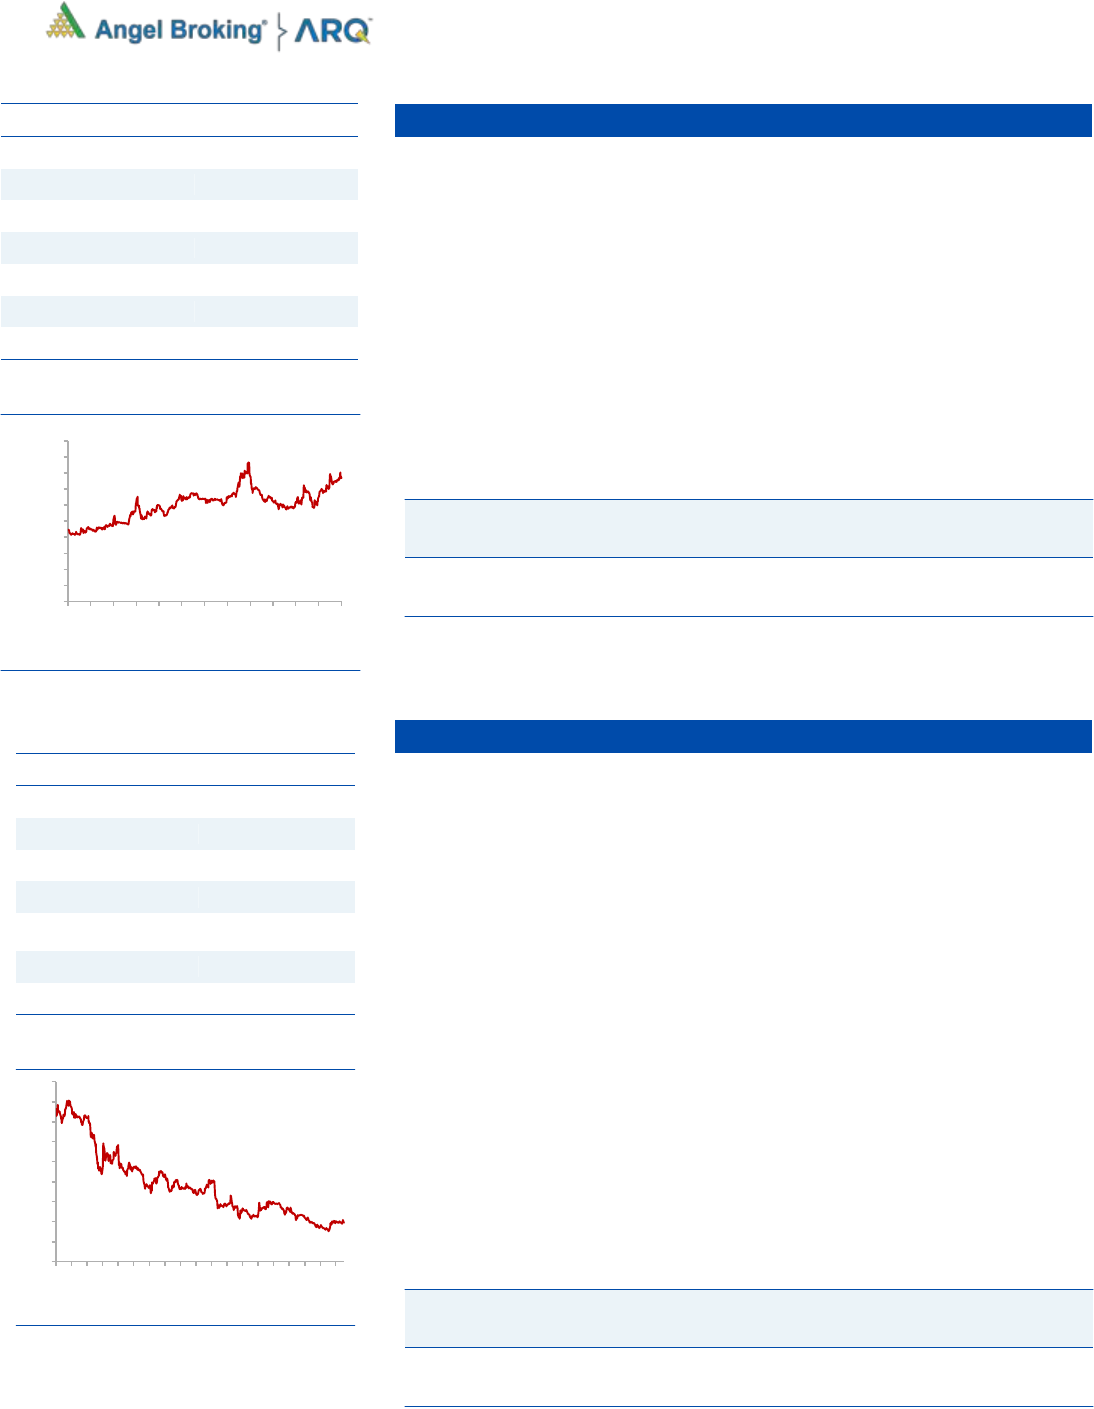
CMP
776
TP
1,000
Upside
28.8%
Sector
Luggage
Market Cap (` cr)
1,743
Beta
0.3
52 Week High / Low
1,005/470
3 year-Chart
Source: Company, Angel Research
0
200
400
600
800
1000
1200
Feb-16
May-16
Aug-16
Nov-16
Feb-17
May-17
Aug-17
Nov-17
Feb-18
May-18
Aug-18
Nov-18
Feb-19
4
Error!
Refer
ence
sourc
Angel Top Picks | February 2019
February 5, 2019
4
Mahindra & Mahindra Ltd.
Mahindra & Mahindra Ltd (M&M) is an India-based company, operating in
nine segments: automotive, farm equipment, IT services, financial services,
steel trading & processing, infrastructure, hospitality, Systech (comprising
automotive components and other related products & services), and Others
(comprising logistics, after-market, two wheelers and investment).
IMD & Skymet have predicted normal monsoon for FY19 for the third
consecutive year which should be a strong trigger for tractor sales growth. In
our view, strong growth in tractor industry would benefit M&M the most due to
strong brand recall and leadership position in farm tractor.
We expect Mahindra & Mahindra (M&M) to report net revenue CAGR of
~13% to ~`62,235cr over FY2018-20E mainly due to healthy growth in
automobile segment like Utility Vehicles (on the back of new launches and
facelift of some models) and strong growth in Tractors segment driven by
strong brand recall and improvement in rural sentiment. Further on the
bottom-line front, we expect CAGR of ~18% to `5600cr over the same period
on the back of margin improvement. Thus, we recommend a Buy rating on the
stock with target price of `1050.
Key Financials
Y/E
Sales
OPM
PAT
EPS
ROE
P/E
P/BV
EV/EBITDA
EV/Sales
March
(` cr)
(%)
(` cr)
(`)
(%)
(x)
(x)
(x)
(x)
FY2019E
54,939
13.0
5,021
42.2
14.7
16.3
2.4
8.9
1.2
FY2020E
62,235
13.0
5,991
50.4
15.4
13.7
2.1
7.8
1.0
Source: Company, Angel Research
Blue Star
BSL is one of the largest air-conditioning companies in India. With a mere 3%
penetration level of ACs vs 25% in China, the overall outlook for the room air-
conditioner (RAC) market in India is favourable.
BSL's RAC business has been outgrowing the industry by ~10% points over the
last few quarters, resulting in the company consistently increasing its market
share. This has resulted in the Cooling Products Division (CPD)'s share in
overall revenues increasing from~23% in FY2010 to ~50% in FY2018
(expected to improve to ~50-55% in FY20E). With strong brand equity and
higher share in split ACs, we expect the CPD to continue to drive growth.
Aided by increasing contribution from the Unitary Products, we expect the
overall top-line to post revenue CAGR of ~13% over FY2018-20E and
margins to improve from 5.8% in FY2018 to 6.2% in FY2020E. We
recommend a Buy rating on the stock.
Key Financials
Y/E
Sales
OPM
PAT
EPS
ROE
P/E
P/BV
EV/EBITDA
EV/Sales
March
(` cr)
(%)
(` cr)
(`)
(%)
(x)
(x)
(x)
(x)
FY2019E
5,122
6.1
154
16.0
17.6
37.6
6.6
19.1
1.2
FY2020E
5,854
6.3
201
20.9
21.0
28.8
6.1
16.1
1.0
Source: Company, Angel Research
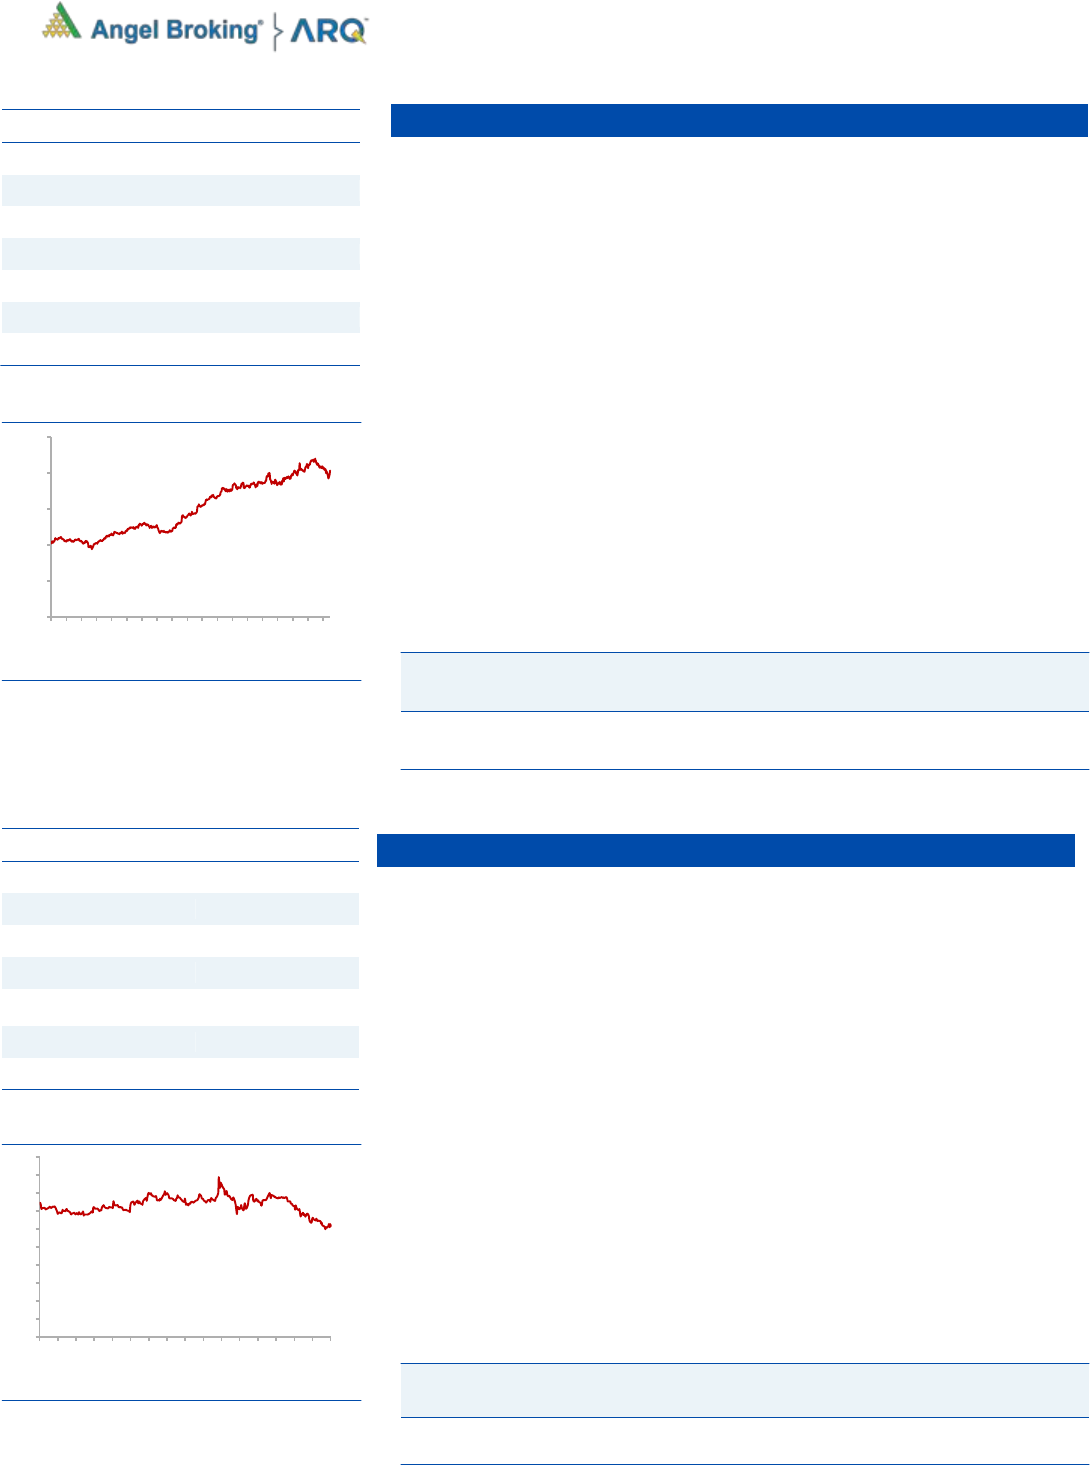
Stock Info
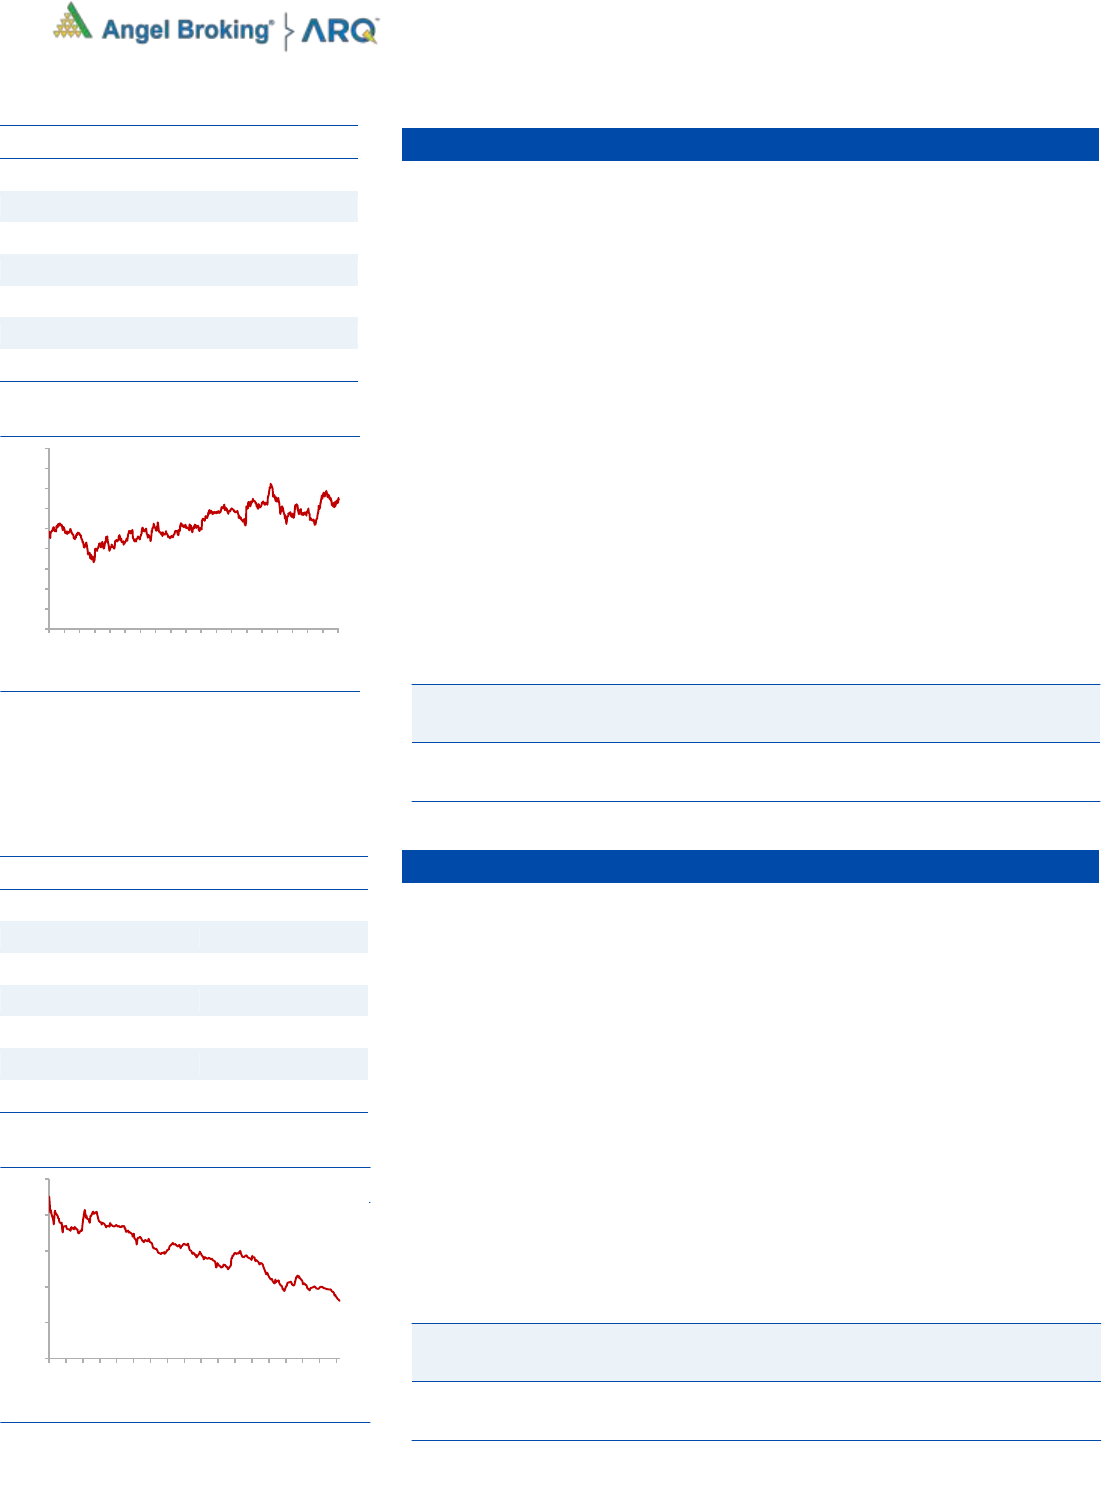
CMP
603
TP
867
Upside
43.7%
Sector
Cons. Durable
Market Cap (` cr)
5,768
Beta
0.2
52 Week High / Low
842 / 507
3 year-Chart
Source: Company, Angel Research
-
100
200
300
400
500
600
700
800
900
Jan-16
Apr-16
Jul-16
Oct-16
Jan-17
Apr-17
Jul-17
Oct-17
Jan-18
Apr-18
Jul-18
Oct-18
Jan-19
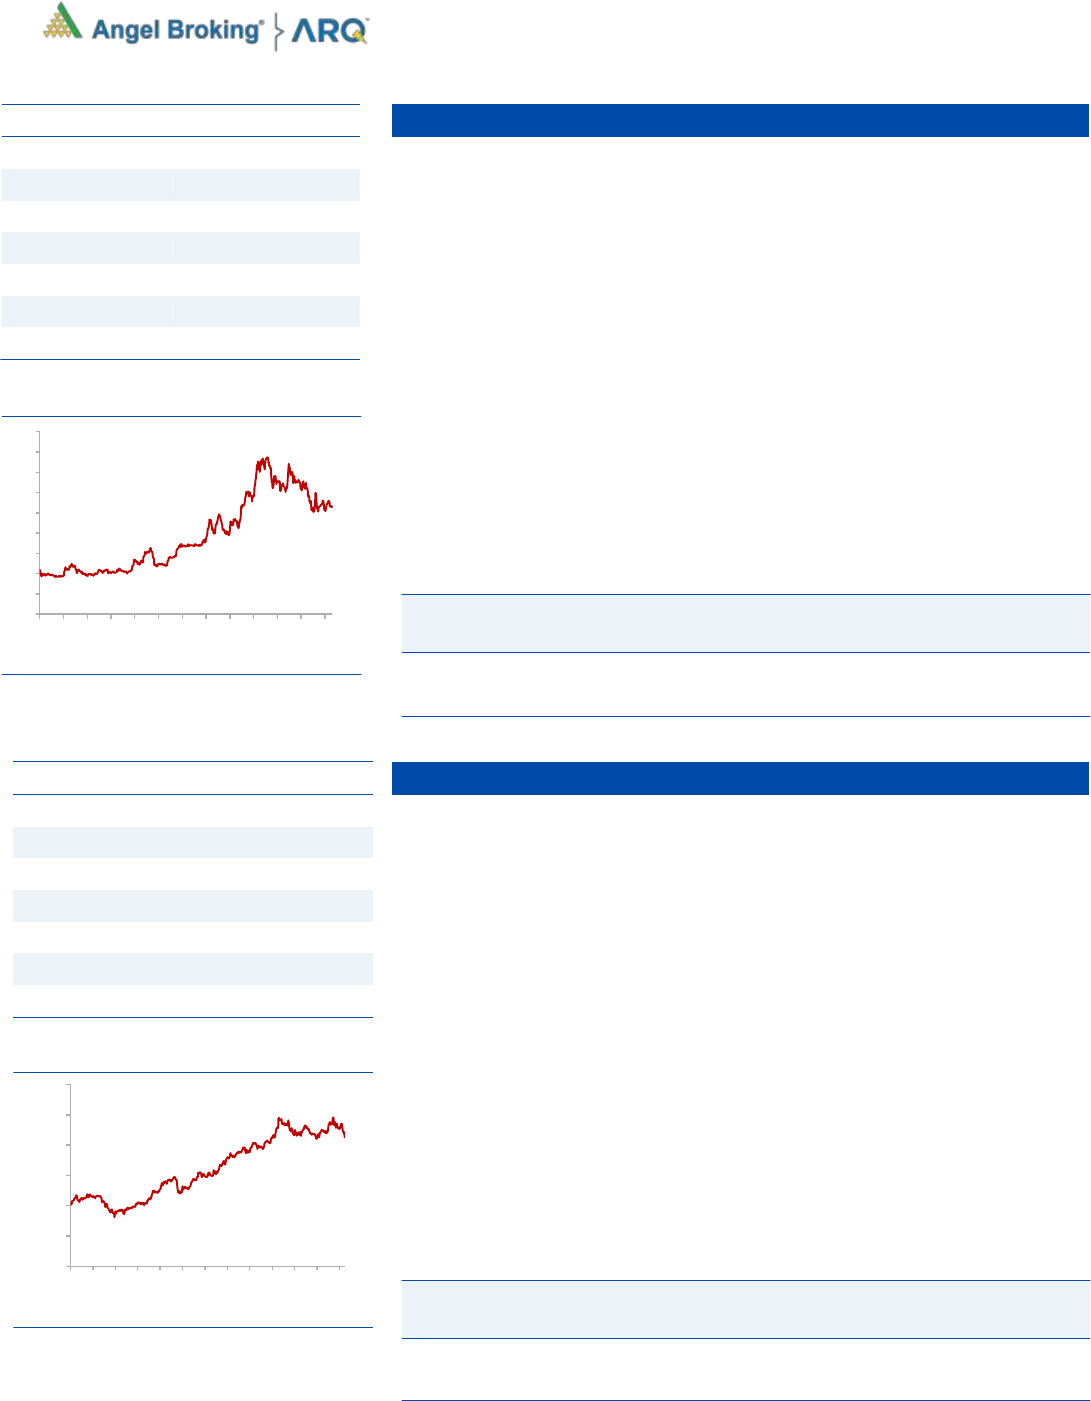
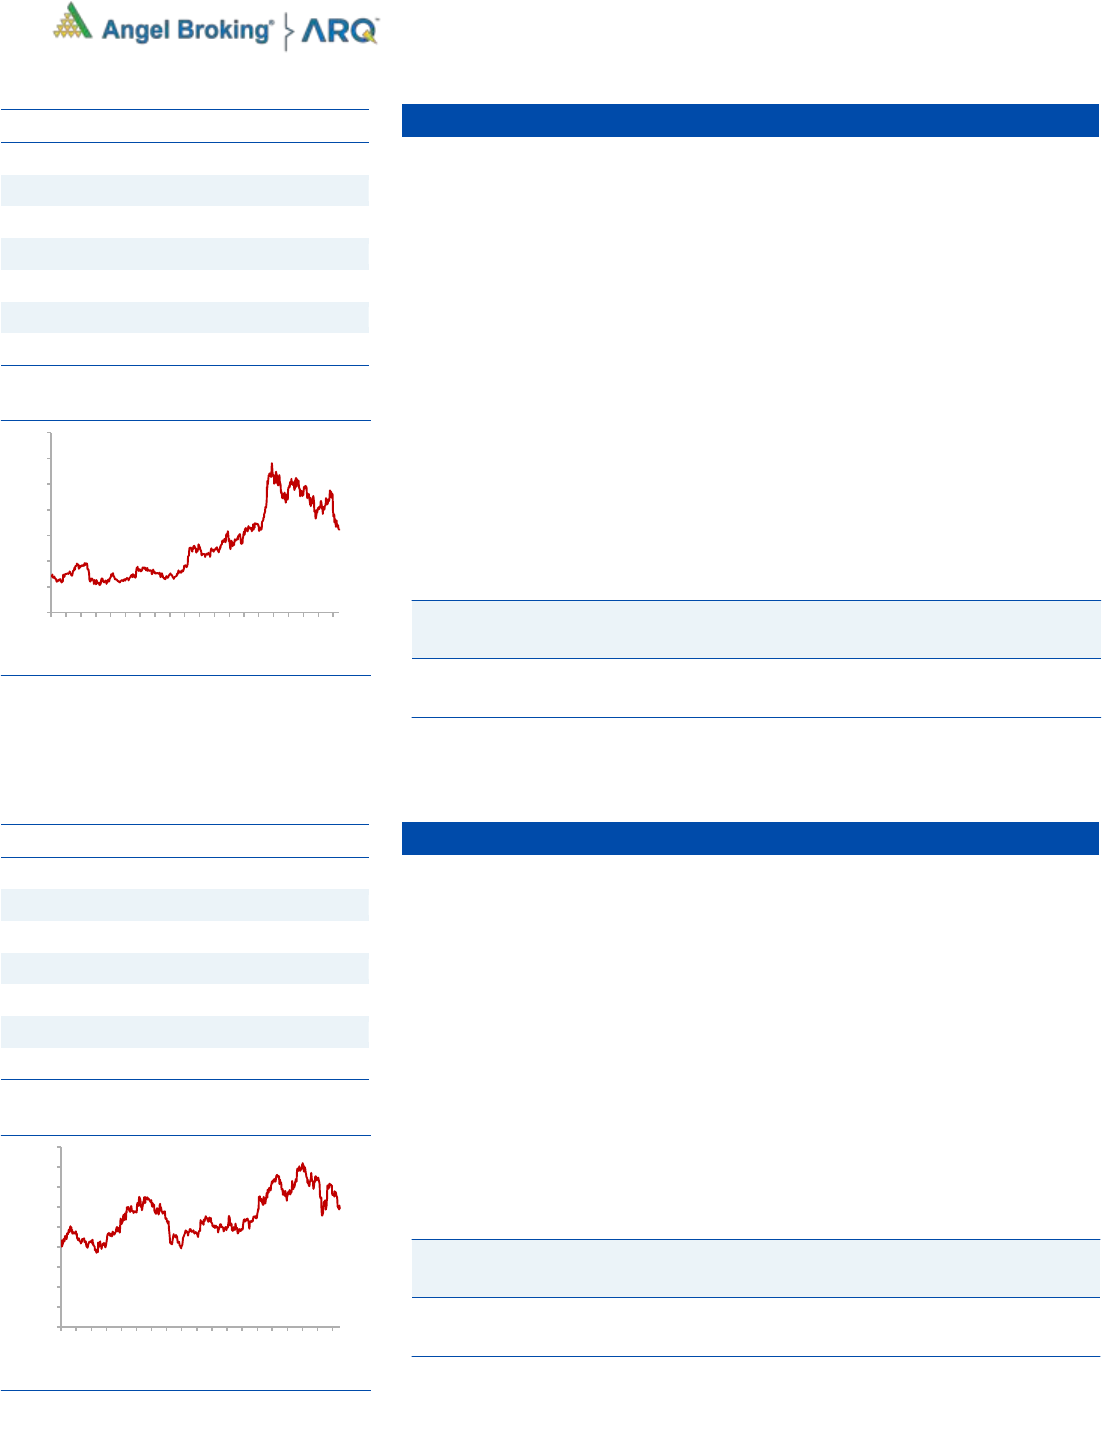
Stock Info
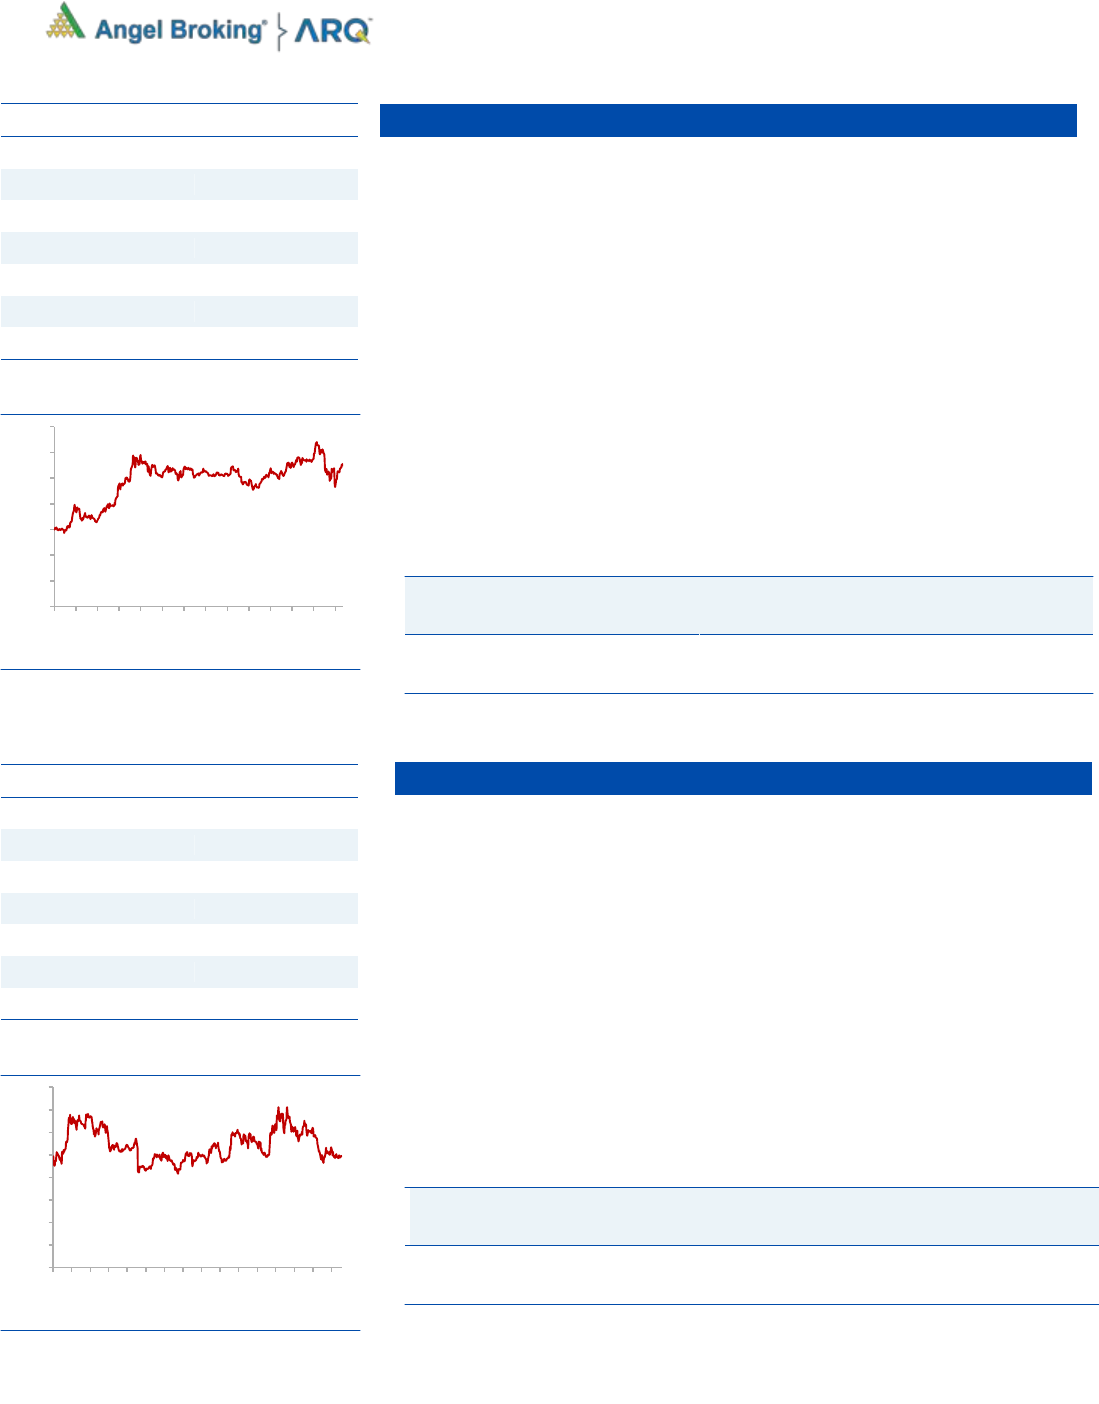
CMP
688
TP
1,050
Upside
52.6%
Sector
Automobile
Market Cap (` cr)
83,598
Beta
0.8
52 Week High / Low
992/662
3 year-Chart
Source: Company, Angel Research
-
200
400
600
800
1,000
1,200
Dec-15
Feb-16
Apr-16
Jun-16
Aug-16
Oct-16
Dec-16
Feb-17
Apr-17
Jun-17
Aug-17
Oct-17
Dec-17
Feb-18
Apr-18
Jun-18
Aug-18
Oct-18
Dec-18
Jan-19
5
Error!
Refer
ence
sourc
Angel Top Picks | February 2019
February 5, 2019
5
Siyaram Silk Mills
SSML has strong brands which cater to premium as well as popular mass
segments of the market. Further, SSML entered the ladies' salwar kameez and
ethnic wear segment. Going forward, we believe that the company would be able to
leverage its brand equity and continue to post strong performance.
The company has a nationwide network of about 1,600 dealers and business
partners. It has a retail network of 160 stores and plans to add another
300-350 stores going forward. Further, the company's brands are sold across
3,00,000 multi brand outlets in the country.
Going forward, we expect SSML to report a net sales CAGR of ~14% to
~`2,272cr and adj.net profit CAGR of ~14% to `150cr over FY2018-20E on
back of market leadership in blended fabrics, strong brand building, wide
distribution channel, strong presence in tier II and tier III cities and emphasis
on latest designs and affordable pricing points. At the current market price,
SSML trades at an inexpensive valuation. We have a buy recommendation on
the stock and target price of `606.
Key Financials
Y/E
Sales
OPM
PAT
EPS
ROE
P/E
P/BV
EV/EBITDA
EV/Sales
March
(` cr)
(%)
(` cr)
(`)
(%)
(x)
(x)
(x)
(x)
FY2019E
1,919
13.5
115
24.6
14.8
13.8
2.0
8.2
1.1
FY2020E
2,207
14.0
146
31.2
16.1
10.9
1.8
6.8
1.0
Source: Company, Angel Research
Maruti Suzuki
The Automobile sector is expected to benefit from the GST implementation.
The sector has seen a pick up in the volumes in FY17 as there were several
positive factors like normal monsoon and lower interest rates.
Maruti Suzuki continues to hold ~52% market share in the passenger vehicles.
The launch of exciting models has helped the company to ride on the
premiumization wave that is happening in the country. In the last two years,
company has seen improvement in the business mix with the pie of the utility
vehicles growing from ~4% to current 15%. The 2-3 months of waiting period
of new models, launch of Swift Hatchback in January-2018 and headroom for
more capacity utilization at Gujarat plant is the near term earning triggers.
Due to the favorable business mix, company has also been seeing
improvement in the margins. Company has already moved from ~11-12%
Together with higher operating leverage at Gujarat plant, increasing Nexa
outlets, and improving business mix, we believe that company has further
room to improve its margins. We have a Buy rating on the stock.
Key Financials
Y/E
Sales
OPM
PAT
EPS
ROE
P/E
P/BV
EV/EBITDA
EV/Sales
March
(` cr)
(%)
(` cr)
(`)
(%)
(x)
(x)
(x)
(x)
FY2019E
90,185
14.7
8,714
288.5
18.1
24.1
4.4
12.6
1.9
FY2020E
103,712
15.3
10,331
342.1
18.8
20.3
3.8
10.1
1.5
Source: Company, Angel Research
Stock Info
CMP
6,957
TP
10,820
Upside
55.5%
Sector
Automobiles
Market Cap (` cr)
2,09,805
Beta
1.0
52 Week High / Low
9,922/6,324
3 year-Chart
Source: Company, Angel Research
-
2,000
4,000
6,000
8,000
10,000
12,000
Jan-16
Apr-16
Jul-16
Oct-16
Jan-17
Apr-17
Jul-17
Oct-17
Jan-18
Apr-18
Jul-18
Oct-18
Jan-19
Stock Info
CMP
340
TP
606
Upside
78.2%
Sector
Textile
Market Cap (` cr)
1,607
Beta
0.7
52 Week High / Low
763/303
3 year-Chart
Source: Company, Angel Research
-
100
200
300
400
500
600
700
800
900
Jan-16
Apr-16
Jul-16
Oct-16
Jan-17
Apr-17
Jul-17
Oct-17
Jan-18
Apr-18
Jul-18
Oct-18
Jan-19
6
Error!
Refer
ence
sourc
Angel Top Picks | February 2019
February 5, 2019
6
HDFC Bank
Capital infusion to propel growth: Bank has to raised `24,000cr capital
through a combination of QIP and preferential allotment. Of these, `8,500cr
has been infused by the bank’s parent company HDFC. Capital Infusion
would help bank to grow advance at healthy CAGR of 22% over FY18-FY20E.
Asset quality has been strong: Strong and steady NIM of 4.4% on the back of
lower cost of funds and lower credit cost will ensure healthy return ratios for
the company. Despite strong growth, the company has maintained stable
asset quality (GNPA/NPA – 1.3%/0.4%).
Subsidiaries: HDFC bank’s subsidiaries, HDB Financial Services (HDBFS) and
HDFC Securities continue to contribute well to the banks overall growth. Their
net profits for FY18 increased by 39% and 60% yoy, respectively. Strong loan
book, well-planned product line and clear customer segmentation aided this
growth.
Outlook: We expect the company’s loan growth to remain 22% over next two
years and earnings growth is likely to be more than 21%. We maintain
Accumulate on the stock with a target price of `2,500.
Key Financials
Y/E
NII
NIM
PAT
EPS
ABV
ROA
ROE
P/E
P/ABV
March
(` cr)
(%)
(` cr)
(`)
(`)
(%)
(%)
(x)
(x)
FY2019E
47,942
4.4
20,990
78.5
537
1.8
16.7
26.8
3.9
FY2020E
58,609
4.5
25,798
96.5
616
1.8
16.6
21.8
3.4
Source: Company, Angel Research
Music Broadcast
Radio Industry is protected by licenses for 15 years, thereby restricting the entry
of new players. This would support the existing companies to strengthen their
position and maintain a healthy growth rate.
It has grabbed the Number 1 position in Mumbai, Bengaluru and Delhi in
terms of number of listener. This is helping MBL to charge premium rate,
which resulting into higher EBITDA margin (33.6%) compare to 22% of ENIL.
MBL outperformed its closest peer with 18.4% CAGR in revenue over FY2013-
17 (ENIL reported 13.2% CAGR in revenue). On the profitability front too,
MBL, with 32.3% CAGR in PAT over FY2013-17, has performed much better
than ENIL (-5.2% CAGR in PAT). Moreover, Radio City posted a six year CAGR
of 12.1% v/s. 9.1% of industry owing to higher advertising volumes.
Capex for 39 licenses have been done for the next 15 years, hence no heavy
incremental Capex requirement would emerge. Moreover, the maintenance
Capex would be as low as `5-10cr. This would leave sufficient cash flow to
distribute as dividend. We have a Buy recommendation on the stock and
target price of `475.
Key Financials
Y/E
Sales
OPM
PAT
EPS
ROE
P/E
P/BV
EV/EBITDA
EV/Sales
March
(` cr)
(%)
(` cr)
(`)
(%)
(x)
(x)
(x)
(x)
FY2019E
331
33.9
62
11
9.6
26.8
2.6
12.4
4.2
FY2020E
370
34.8
72
13
10.2
23.2
2.4
10.9
3.8
Source: Company, Angel Research
Stock Info
CMP
299
TP
475
Upside
58.8%
Sector
Media
Market Cap (` cr)
1,604
Beta
0.5
52 Week High / Low
407/267
3 year-Chart
Source: Company, Angel Research
-
50
100
150
200
250
300
350
400
450
500
Oct-17
Nov-17
Dec-17
Jan-18
Feb-18
Mar-18
Apr-18
May-18
Jun-18
Jul-18
Aug-18
Sep-18
Oct-18
Nov-18
Dec-18
Jan-19
Feb-19
Stock Info
CMP
2,092
TP
2,500
Upside
19.5%
Sector
Banking
Market Cap (` cr)
5,68,580
Beta
0.8
52 Week High / Low
2219/1830
3 year-Chart
Source: Company, Angel Research
-
500
1,000
1,500
2,000
2,500
Jan-16
Mar-16
May-16
Jul-16
Sep-16
Nov-16
Jan-17
Mar-17
May-17
Jul-17
Sep-17
Nov-17
Jan-18
Mar-18
May-18
Jul-18
Sep-18
Nov-18
Jan-19
7
Error!
Refer
ence
sourc
Angel Top Picks | February 2019
February 5, 2019
7
KEI Industries
KEI’s current order book (OB) stands at `2,570cr (segmental break-up: out
which EPC is around `1,425cr and balance from cables, substation & EHV). Its
OB grew by ~28% in the last 3 years due to strong order inflows from State
Electricity Boards, Power grid, etc.
KEI’s consistent effort to increase its retail business from 30-32% of revenue in
FY18 to 40-45% of revenue in the next 2-3 years on the back of strengthening
distribution network (currently 926 which is expect to increase `1,500 by FY19)
and higher ad spend (increased from `2cr in FY13 to `7.5cr in FY17 and
expected to spend).
KEI’s export (FY18 – 16% of revenue) is expected to reach a level 20% in next
two years with higher order execution from current OB and participation in
various international tenders. We expect a strong ~25% growth CAGR over
FY2018-20 in exports. We expect KEI to report net revenue CAGR of ~16% to
~`4,646cr and net profit CAGR of ~19% to `207cr over FY2018-20E. Hence
we have a Buy rating on the stock.
Key Financials
Y/E
Sales
OPM
PAT
EPS
ROE
P/E
P/BV
EV/EBITDA
EV/Sales
March
(` cr)
(%)
(` cr)
(`)
(%)
(x)
(x)
(x)
(x)
FY2019E
4,064
10.0
178
23.0
23.0
16.0
3.7
8.6
0.9
FY2020E
4,707
10.0
215
27.8
22.1
13.2
2.9
7.3
0.7
Source: Company, Angel Research
GIC Housing Finance Ltd
GICHF has healthy capital adequacy, and is seeing an increase in demand for
home loans. GICHF’s loan book is expected to report 18% loan growth over
next two years.
GICHF is consistently decreased bank borrowing and increased high yield
loan book which has improved Net Interest Margin over last 3 years. The
share of bank borrowing was 75% in FY15, which fell to 54% in FY18. In our
opinion, Present liquidity issue would not impact GIC Housing for raising new
fund considering strong parentage.
GICHF’s asset quality is on the higher side compared to other HFCs (As on
Q2FY19 GNPA-3.11%). This is primarily due to GICHF has not written off any
bad asset and has not sold any bad assets to ARC. New Management is
expediting asset quality improvement.
We expect the GICHF’s loan growth to grow at a CAGR of 18% over next two
years. We have a Buy rating on the stock.
Key Financials
Y/E
Op. Inc
NIM
PAT
EPS
ABV
ROA
ROE
P/E
P/ABV
March
(` cr)
(%)
(` cr)
(`)
(`)
(%)
(%)
(x)
(x)
FY2019E
429
3.5
173
32
211
1.7
20
7.6
1.2
FY2020E
537
3.6
218
41
246
1.7
21
6.1
1.0
Source: Company, Angel Research
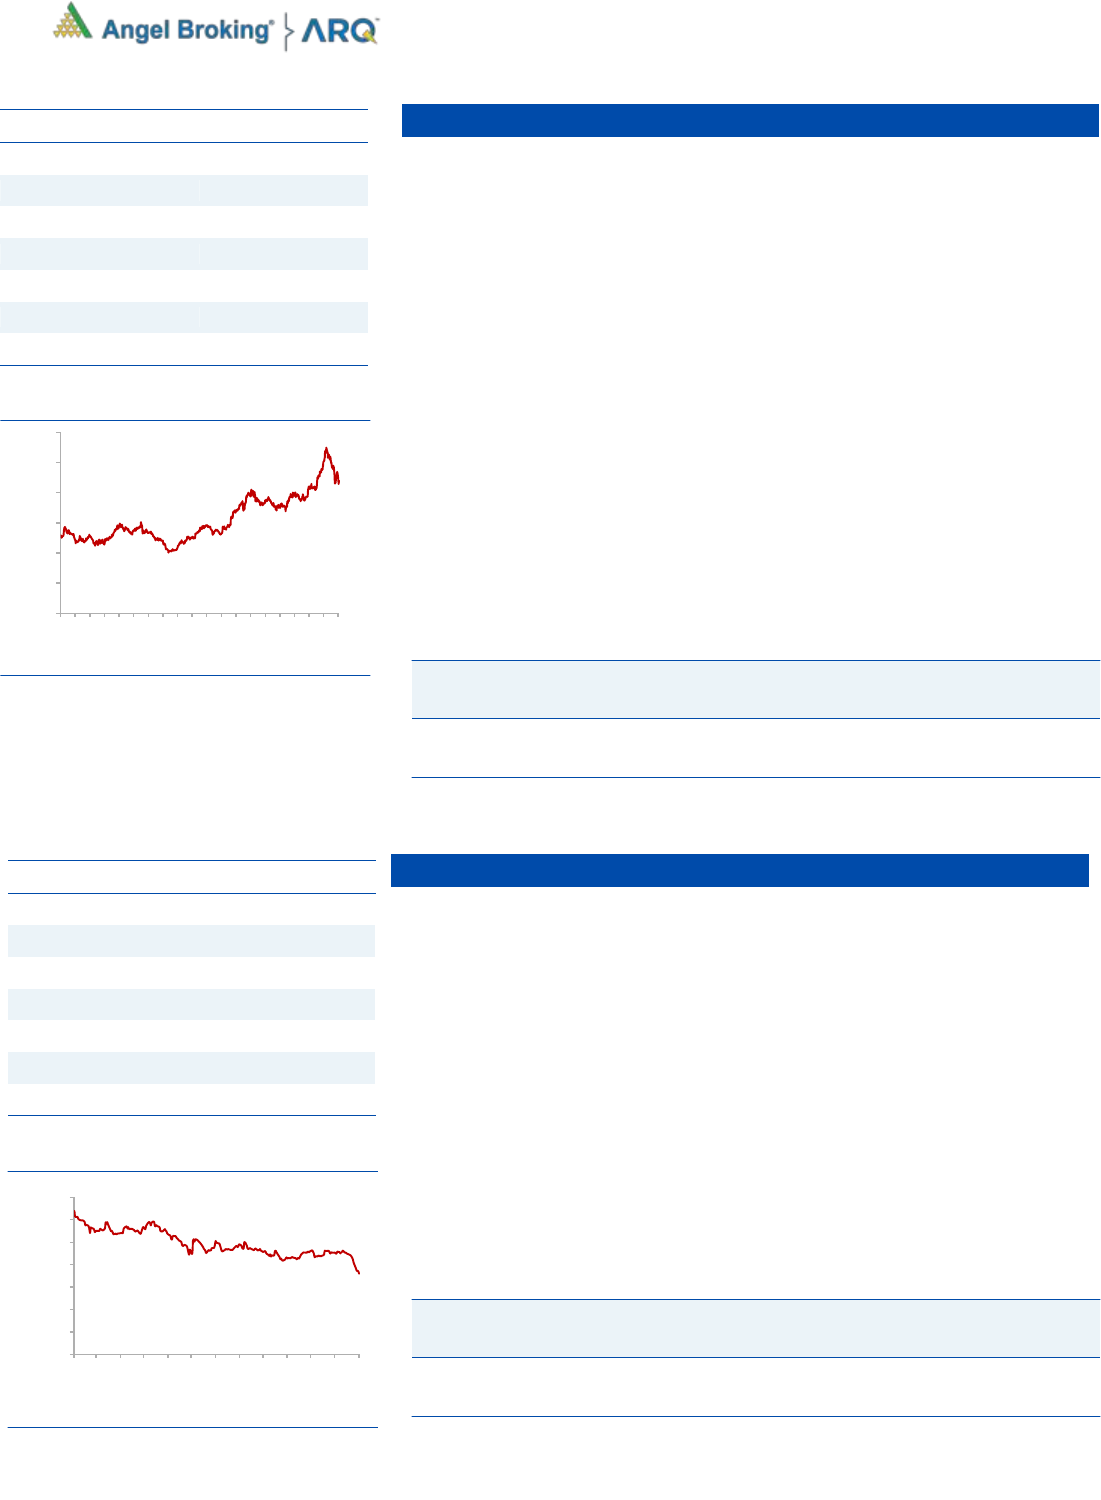
Stock Info
CMP
338
TP
419
Upside
24%
Sector
cable
Market Cap (` cr)
2,629
Beta
1.7
52 Week High / Low
371 / 106
3 year-Chart
Source: Company, Angel Research
-
50
100
150
200
250
300
350
400
Nov-14
Feb-15
May-15
Jul-15
Oct-15
Jan-16
Apr-16
Jul-16
Oct-16
Jan-17
Apr-17
Jul-17
Oct-17
Stock Info
CMP
430
TP
Upside
%
Sector
Real Estate
Market Cap (` cr)
2,156
Beta
1.1
52 Week High / Low
530 / 318
3 year-Chart
Source: Company, Angel Research
-
100
200
300
400
500
600
Nov-14
Feb-15
May-15
Jul-15
Oct-15
Jan-16
Apr-16
Jul-16
Oct-16
Jan-17
Apr-17
Jul-17
Oct-17
Stock Info
CMP
368
TP
486
Upside
32.1%
Sector
Cable
Market Cap (` cr)
2,896
Beta
1.3
52 Week High / Low
494/248
3 year-Chart
Source: Company, Angel Research
-
100
200
300
400
500
600
Jan-16
Apr-16
Jul-16
Oct-16
Jan-17
Apr-17
Jul-17
Oct-17
Jan-18
Apr-18
Jul-18
Oct-18
Jan-19
Stock Info
CMP
243
TP
424
Upside
74.4%
Sector
Financials
Market Cap (` cr)
1,243
Beta
1.3
52 Week High / Low
450/213
3 year-Chart
Source: Company, Angel Research
-
100
200
300
400
500
600
700
Jan-16
Apr-16
Jul-16
Oct-16
Jan-17
Apr-17
Jul-17
Oct-17
Jan-18
Apr-18
Jul-18
Oct-18
Jan-19
8
Error!
Refer
ence
sourc
Angel Top Picks | February 2019
February 5, 2019
8
TTK Prestige
TTK Prestige (TTK) is the leading brands in kitchen appliances with 40%+
market share in organized market. It has successfully transformed from a
single product company to a multi product company offering an entire gamut
of kitchen and home appliances (600+ products).
It has also launched a economy range – ‘Judge Cookware’ to capture the
untapped demand especially at the bottom end of the pyramid. It is expecting
good growth in cleaning solution.
It expects to double its revenue in the next five years backed by revival in
consumption demand, new 5 cr LPG connections under the Ujjawala Scheme,
inorganic expansion and traction in exports. We expect TTK to report a CAGR
of 19%/24% in revenue/PAT respectively over FY2018-20E.
Key Financials
Y/E
Sales
OPM
PAT
EPS
ROE
P/E
P/BV
EV/EBITDA
EV/Sales
March
(` cr)
(%)
(` cr)
(`)
(%)
(x)
(x)
(x)
(x)
FY2019E
2,254.1
14.1
205.2
177.8
17.3
43.3
5.7
11.7
3.9
FY2020E
2,648.8
14.3
246.8
213.8
17.8
36.0
4.9
9.1
3.2
Source: Company, Angel Research
Inox Wind
Inox Wind is India’s leading wind energy solutions provider servicing IPPs,
Utilities, PSUs, Corporates and Retail Investors.
We expect Inox Wind to report exponential growth in top-line and bottom-line
over FY19-20E. The growth would be led by changing renewable energy
industry dynamics in favor of wind energy segment viz. changes in auction
regime from Feed-In-Tariff (FIT) to Reverse auction regime and Government’s
guidance for increasing wind energy capacity from 34GW current to 140GW
by 2030.
Further, being the lowest wind turbine producer globally coupled with healthy
order book of 780 MW and in dicscussion with other IPP’s for another 600
MW order along with low debt equity, we believe INOX Wind is in a sweet spot
to tap the upcoming opportunity in renewable energy segments.
At the CMP of `70, Inox Wind is trading at 4.4x FY20E EPS of `16.9.
Considering the above positives, we assign a multiple of 7.5X on FY20EPS to
arrive at a target price of `120 (potential upside of 70% over a period of the
next 12-18 months)
Key Financials
Y/E
Sales
OPM
PAT
EPS
ROE
P/E
P/BV
EV/EBITDA
EV/Sales
March
(` cr)
(%)
(` cr)
(`)
(%)
(x)
(x)
(x)
(x)
FY2019E
3,005
15%
228
10.3
10.2
6.8
0.7
4.0
3.2
FY2020E
4,036
15%
355
16.0
13.7
4.4
0.6
2.8
3
Source: Company, Angel Research
Stock Info
CMP
7,705
TP
8,200
Upside
6.4%
Sector
Houseware
Market Cap (` cr)
9,153
Beta
1.2
52 Week High / Low
8100/5500
3 year-Chart
Source: Company, Angel Research
0
1,000
2,000
3,000
4,000
5,000
6,000
7,000
8,000
9,000
10,000
Jan-16
Apr-16
Jul-16
Oct-16
Jan-17
Apr-17
Jul-17
Oct-17
Jan-18
Apr-18
Jul-18
Oct-18
Jan-19
Stock Info
CMP
70
TP
120
Upside
71.4%
Sector
Wind-Power
Market Cap (` cr)
1,469
Beta
0.3
52 Week High / Low
139/65
3 year-Chart
Source: Company, Angel Research
-
50
100
150
200
250
300
350
400
450
Jan-16
Mar-16
May-16
Jul-16
Sep-16
Nov-16
Jan-17
Mar-17
May-17
Jul-17
Sep-17
Nov-17
Jan-18
Mar-18
May-18
Jul-18
Sep-18
Nov-18
Jan-19
9
Error!
Refer
ence
sourc
Angel Top Picks | February 2019
February 5, 2019
9
RBL Bank
RBL Bank (RBK) has grown its loan book at healthy CAGR of 56% over FY10-
18. We expect it to grow at 30% over FY18-20E. With adequately diversified,
well capitalised B/S, RBK is set to grab market share from corporate lenders
(esp.PSUs)
The retail loan portfolio grew 56% YoY to `14,644cr and now constitutes
29.4% of the loan book (18% share in 4QFY17).NIM has expanded to 4.12%,
up 4bps YoY, despite a challenging interest rate scenario on the back of a
changing portfolio mix and lower cost of deposits. The management stated
that the bank is slated to breach 4% NIM early in FY19.
RBL Bank currently trades at 2.9x its FY2020E price to book value, which we
believe is reasonable for a bank in a high growth phase with stable asset
quality.
Key Financials
Y/E
Op. Inc.
NIM
PAT
EPS
ABV
ROA
ROE
P/E
P/ABV
March
(` cr)
(%)
(` cr)
(`)
(`)
(%)
(%)
(x)
(x)
FY2019E
2,478
3.6
914
22
173
1.3
13
26
3.3
FY2020E
3,219
3.6
1,195
28
196
1.3
15
20
2.9
Source: Company, Angel Research
Parag Milk Foods
Parag Milk Foods (PARAG) is one of the leading dairy products companies in
India. The company has been successful in creating strong brands like GO,
Gowardhan and in introducing new products like Whey Protein. It has become
the 2nd player in processed cheese (after Amul) in a short span of 10 years
and commands 33% market share.
Value Added Products like cheese, whey protein enjoy higher gross margins
of 25-45% versus 6-8% entailed in liquid milk. VAP forms ~66% to its revenue
(the highest among the listed players versus 25-30% for others). Driven by
recently launched products and higher share of VAP, its operating margins
would improve in next few years.
We expect PARAG to report net revenue/PAT CAGR of 17%/35% respectively
over FY2018-20E.
Key Financials
Y/E
Sales
OPM
PAT
EPS
ROE
P/E
P/BV
EV/EBITDA
EV/Sales
March
(` cr)
(%)
(` cr)
(`)
(%)
(x)
(x)
(x)
(x)
FY2019E
2,271
10.4
115
13.7
13.4
18.1
2.4
11.7
1.0
FY2020E
2,706
11.1
162
19.3
15.9
12.7
2.1
9.1
0.8
Source: Company, Angel Research
Stock Info
CMP
578
TP
690
Upside
19.3%
Sector
Banking
Market Cap (` cr)
24,989
Beta
0.9
52 Week High / Low
652/438
3 year-Chart
Source: Company, Angel Research
-
100
200
300
400
500
600
700
Nov-16
Jan-17
Mar-17
May-17
Jul-17
Sep-17
Nov-17
Jan-18
Mar-18
May-18
Jul-18
Sep-18
Nov-18
Jan-19
Stock Info
CMP
205
TP
330
Upside
34.5%
Sector
Dairy
Market Cap (` cr)
1,736
Beta
1.1
52 Week High / Low
414/202
3 year-Chart
Source: Company, Angel Research
-
50
100
150
200
250
300
350
400
Jun-16
Aug-16
Oct-16
Dec-16
Feb-17
Apr-17
Jun-17
Aug-17
Oct-17
Dec-17
Feb-18
Apr-18
Jun-18
Aug-18
Oct-18
Dec-18
10
Error!
Refer
ence
sourc
Angel Top Picks | February 2019
February 5, 2019
10
ICICI Bank
ICICI bank has taken a slew of steps to strengthen its balance sheet. Measures
such as Incremental lending to higher rated corporates, reducing
concentration in few stressed sectors and building up the retail loan book. The
share of retail loans in overall loans increased to 57.5% (2QFY19) from 38%
in FY12.
Asset quality likely to stabilize going ahead: ICICI bank’s slippages remained
high during FY18 and hence GNPA went up to 8.8% vs. 5.8% in FY16. We
expect addition to stress assets to reduce and credit costs to further decline
owing to incremental lending to higher rated corporate and faster resolution in
Accounts referred to NCLT under IBC.
The gradual improvement in recovery of bad loans would reduce credit costs,
that would help to improve return ratio. The strength of the liability franchise,
shift in loan mix towards retail assets and better rated companies, and
improvement in bad loans would be a key trigger for multiple expansion. We
recommend a Buy rating on the stock, with a price target of `416.
Key Financials
Y/E
NII
NIM
PAT
EPS
ABV
ROA
ROE
P/E
P/ABV
March
(` cr)
(%)
(` cr)
(`)
(`)
(%)
(%)
(x)
(x)
FY2019E
26,797
3.2
5,795
9
147
0.6
5
39
2.4
FY2020E
31,339
3.3
13,264
21
164
1.3
12
17
2.2
Source: Company, Angel Research
Aditya Birla Capital
Aditya Birla Capital (ABCL) is one of the most diversified financial services
entities, with a presence in non-bank financing, asset management, housing
finance, insurance and advisory businesses.
ABFL (NBFC) business contributes highest value in our SOTP valuation. It has
recorded a strong CAGR of 42% over FY13-18. Despite aggressive growth in
lending and migration to 90dpd for NPA recognition, GNPA has remained at
~1%. We believe ABFL would be able to continue to grow at 25% CAGR over
FY18-FY20E.
We expect financialization of savings, increasing penetration in Insurance &
Mutual funds would ensure steady growth. Further, Banca tie-up with HDFC
Bank, DBS and LVB should restore insurance business. We recommend a Buy
rating on the stock, with a price target of `151.
Key Financials
Y/E
Op. Inc
PAT
EPS
ABV
ROE
P/E
P/BV
March
(` cr)
(` cr)
(`)
(`)
(%)
(x)
(x)
FY2019E
2,173
1,228
5.6
44.9
12
14
1.8
FY2020E
3,043
1,654
7.5
52.4
14
11
1.5
Source: Company, Angel Research
Stock Info
CMP
863
TP
1091
Upside
26.4%
Sector
Pharmaceutical
Market Cap (` cr)
39025
Beta
0.7
52 Week High / Low
1572/807
3 year-Chart
Source: Company, Angel Research
Stock Info
CMP
81
TP
151
Upside
86.4%
Sector
NBFC
Market Cap (` cr)
18,161
Beta
0.7
52 Week High / Low
172/79
3 year-Chart
Source: Company, Angel Research
-
50
100
150
200
250
Sep-17
Oct-17
Nov-17
Dec-17
Jan-18
Feb-18
Mar-18
Apr-18
May-18
Jun-18
Jul-18
Jul-18
Aug-18
Sep-18
Oct-18
Nov-18
Dec-18
Jan-19
Stock Info
CMP
355
TP
416
Upside
17.2%
Sector
Banking
Market Cap (` cr)
2,25,603
Beta
1.7
52 Week High / Low
383/256
3 year-Chart
Source: Company, Angel Research
-
50
100
150
200
250
300
350
400
450
Dec-15
Feb-16
Apr-16
Jun-16
Aug-16
Oct-16
Dec-16
Feb-17
Apr-17
Jun-17
Aug-17
Oct-17
Dec-17
Feb-18
Apr-18
Jun-18
Aug-18
Oct-18
Dec-18
Jan-19
11
Error!
Refer
ence
sourc
Angel Top Picks | February 2019
February 5, 2019
11
Aurobindo Pharmaceuticals
Aurobindo Pharmaceuticals is an India-based leading global generic
company. It’s predominately formulations Export Company, with USA &
Europe contributing ~80% of sales (FY2018).
Recently it acquired dermatology and oral solids businesses from Sandoz Inc.,
USA. With this acquisition, Aurobindo adds sales of US$0.9bn and would
become the 2
nd
largest generic player in the US by number of prescriptions.
Aurobindo has a robust pipeline (has filed 510 ANDA’s; second highest
amongst Indian companies) & is investing to enhance its foray into complex
generic (mainly injectables, ophthalmic etc.) & biosimilar, which will drive its
next leg of growth.
We expect Aurobindo to report net revenue CAGR of ~22% & net profit to
grow at ~19% CAGR during FY2018-20E, aided by acquisitions. Valuations of
the company are cheap V/s its peers and own fair multiples of 17-18x. We
recommend BUY rating.
Key Financials
Y/E
Sales
OPM
PAT
EPS
ROE
P/E
P/BV
EV/EBITDA
EV/Sales
March
(` cr)
(%)
(` cr)
(`)
(%)
(x)
(x)
(x)
(x)
FY2019E
18,701
20.9
2,641
45.2
20.6
17.7
3.3
12.7
2.6
FY2020E
24,163
21.6
3,446
59.0
22.2
13.5
2.7
9.4
2.0
Source: Company, Angel Research
GMM Pfaudler Ltd.
GMM Pfaudler Limited (GMM) is the Indian market leader in glass-lined (GL)
steel equipment used in corrosive chemical processes of agrochemicals,
specialty chemical and pharma sector. The company is seeing strong order
inflow from the user industries which is likely to provide 20%+ growth outlook
for next couple of years.
GMM has also increased focus on the non-GL business, which includes mixing
equipment, filtration and drying equipment for the chemical processing
industry. It is expecting to increase its share of non-GL business to 50% by
2020.
GMM is likely to maintain the 20%+ growth trajectory over FY18-20 backed
by capacity expansion and cross selling of non-GL products to its clients.
Key Financials
Y/E
Sales
OPM
PAT
EPS
ROE
P/E
P/BV
EV/EBITDA
EV/Sales
March
(` cr)
(%)
(` cr)
(`)
(%)
(x)
(x)
(x)
(x)
FY2019E
480.8
17.1
56.1
38.5
20.2
27.3
5.7
17.3
3.0
FY2020E
577.6
17.1
67.4
46.2
20.1
23.2
4.7
14.3
2.5
Source: Company, Angel Research
Stock Info
CMP
799
TP
890
Upside
11.4%
Sector
Pharmaceuticals
Market Cap (` cr)
45,47
Beta
1.2
52 Week High / Low
830/527
3 year-Chart
Source: Company, Angel Research
-
100
200
300
400
500
600
700
800
900
1,000
Jan-16
Mar-16
May-16
Jul-16
Sep-16
Nov-16
Jan-17
Mar-17
May-17
Jul-17
Sep-17
Nov-17
Jan-18
Mar-18
May-18
Jul-18
Sep-18
Nov-18
Jan-19
Stock Info
CMP
1,096
TP
1,200
Upside
17.4%
Sector
Machinery
Market Cap (` cr)
1,607
Beta
0.7
52 Week High / Low
1289/636
3 year-Chart
Source: Company, Angel Research
0
200
400
600
800
1,000
1,200
1,400
Feb-16
May-16
Aug-16
Nov-16
Feb-17
May-17
Aug-17
Nov-17
Feb-18
May-18
Aug-18
Nov-18
Feb-19
12
Error!
Refer
ence
sourc
Angel Top Picks | February 2019
February 5, 2019
12
Jindal Steel & Power Ltd.
The company has increased its crude steel capacity more than double in last
five years from 3.6 MTPA to 8.6 MTPA and currently running at ~50%
utilization.
Owing to continuous demand of steel from infrastructure, housing and auto
sectors along with limited addition of steel capacity in near term and favorable
government policies augur well for JSPL to perform well going forward, we
expect JSPL’s utilization to improve to 80-85% by FY19 along with reduction in
debt led by improving in realization..
In power segments, During the year Jindal Power limited (JPL) has signed a
250MW PPA and it is in discussions with various utilities for another 300MW
PPA, we expects JPL to generate ~ 1,700 MW units by FY19 due to increasing
demand of power.
JSPL is trading at attractive valuation to its peer, we value the stock based on
asset based approach of Steel segment on EV/Tonne basis and Power segment
on EV/MW basis.
Key Financials
Y/E
Sales
OPM
PAT
EPS
ROE
P/E
P/BV
EV/EBITDA
EV/Sales
March
(` cr)
(%)
(` cr)
(`)
(%)
(x)
(x)
(x)
(x)
FY2019E
38,967
22.5
844
8.7
2.7
18.1
0.49
6.0
1.37
FY2020E
45,973
24.1
2547
26
8
6
0.45
4.3
1.04
Source: Company, Angel Research
Shriram Transport Finance
SHTF's primary focus is on financing pre-owned commercial vehicles. CV/LCV
sales grew by 20%/25% in FY18, respectively. We expect AUM to grow at
healthy CAGR of 20% over FY2018-20E led by pick up in infra/ construction
before 2019 elections, macro revival and Ramping up in rural distribution.
In last three year SHTF, GNPA and credit cost has been increased primarily
due to the transition of NPA recognition from 180DPD to 90DPD (Q4FY18).
FY19 Onward we expect asset quality to improve and credit cost to normalise,
this would help to improve return ratio.
We expect loan book/PAT CAGR of 20%/45% respectively over FY2018-20E.
At 1.8x FY20E ABV, Valuation appears reasonable.
Key Financials
Y/E
NII
NIM
PAT
EPS
ABV
ROA
ROE
P/E
P/ABV
March
(` cr)
(%)
(` cr)
(`)
(`)
(%)
(%)
(x)
(x)
FY2019E
8,042
9.0
2,315
102
674
2.4
17
10
1.9
FY2020E
9,702
9.1
3,284
145
796
2.8
20
7
1.5
Source: Company, Angel Research
Stock Info
CMP (`)
130
TP (`)
250
Upside
91%
Sector
Steel& Power
Market Cap (` cr)
12,569
Beta
2.6
52 Week High / Low
259/125
3 year-Chart
Source: Company, Angel Research
-
50
100
150
200
250
300
350
Nov-15
Jan-16
Mar-16
May-16
Jul-16
Sep-16
Nov-16
Jan-17
Mar-17
May-17
Jul-17
Sep-17
Nov-17
Jan-18
Mar-18
May-18
Jul-18
Sep-18
Nov-18
Jan-19
Stock Info
CMP
1,044
TP
1,764
Upside
68.9%
Sector
NBFC
Market Cap (` cr)
23,440
Beta
0.9
52 Week High / Low
1670/903
3 year-Chart
Source: Company, Angel Research
-
200
400
600
800
1,000
1,200
1,400
1,600
1,800
Jan-16
Mar-16
May-16
Jul-16
Sep-16
Nov-16
Jan-17
Mar-17
May-17
Jul-17
Sep-17
Nov-17
Jan-18
Mar-18
May-18
Jul-18
Sep-18
Nov-18
Jan-19
13
Error!
Refer
ence
sourc
Angel Top Picks | February 2019
February 5, 2019
13
Bata India
Bata India Ltd (BIL) is the largest footwear retailer in India, offering footwear,
accessories and bags across brands like Bata, Hush Puppies, Naturalizer,
Power, etc. BIL’s ~70% revenue is derived from Men & Kids segment and
balance from women’s segment. BIL has over 1,400 Bata retail stores across
India.
Further, over the last 3 years, the company has added 135 stores (net
addition). Going forward, the company has plans to open 500 stores (already
identified 435 cities) mainly in tier-II and tier-III cities over the next 4-5 years.
We expect BIL to report net revenue CAGR of ~16% to ~`3,555cr over
FY2018-20E mainly due increasing brand consciousness amongst Indian
consumers, new product launches and focus on women’s segment (high
growth segment). Further, on the bottom-line front, we expect CAGR of ~19%
to `323cr over the same period on the back of margin improvement
(increasing premium product sales). Thus, we initiate coverage on Bata India
with Buy recommendation and Target Price of `1,243.
Key Financials
Y/E
Sales
OPM
PAT
EPS
ROE
P/E
P/BV
EV/EBITDA
EV/Sales
March
(` cr)
(%)
(` cr)
(`)
(%)
(x)
(x)
(x)
(x)
FY2019E
3,005
14.5
280
21.8
16.3
52.5
8.6
32.1
4.7
FY2020E
3,494
14.7
329
25.6
16.6
44.7
7.4
27.0
4.0
Source: Company, Angel Research
Amber Enterprises
Amber Enterprises India Ltd. (Amber) is the market leader in the room air
conditioners (RAC) outsourced manufacturing space in India. It is a one-stop
solutions provider for the major brands in the RAC industry and currently
serves eight out of the ten top RAC brands in India.
In line with its strategy to capture more wallet share, it has made 2 acquisitions
in the printed circuit board (PCB) manufacturing space over the last 1 year
which will boost its manufacturing capabilties.
We expect Amber to report consolidated revenue/PAT CAGR of 28%/51%
respectively over FY2018-20E. Its growing manufacturing capabilities and
scale put it in a sweet spot to capture the underpenetrated RAC market in
India.
Key Financials
Y/E
Sales
OPM
PAT
EPS
ROE
P/E
P/BV
EV/EBITDA
EV/Sales
March
(` cr)
(%)
(` cr)
(`)
(%)
(x)
(x)
(x)
(x)
FY2019E
2,914.0
7.5
110.8
35.9
11.2
20.6
2.3
9.6
0.7
FY2020E
3,438.6
7.5
140.2
45.4
12.7
16.3
2.1
7.9
0.6
Source: Company, Angel Research
Stock Info
CMP
1,144
TP
1,243
Upside
8.6%
Sector
Footwear
Market Cap (` cr)
14,884
Beta
0.9
52 Week High / Low
1,177/656
3 year-Chart
Source: Company, Angel Research
-
200
400
600
800
1,000
1,200
Dec-15
Feb-16
Apr-16
Jun-16
Aug-16
Oct-16
Dec-16
Feb-17
Apr-17
Jun-17
Aug-17
Oct-17
Dec-17
Feb-18
Apr-18
Jun-18
Aug-18
Oct-18
Dec-18
Jan-19
Stock Info
CMP
727
TP
1,135
Upside
56.2%
Sector
Electronics
Market Cap (` cr)
2,172
Beta
0.9
52 Week High / Low
1274/672
3 year-Chart
Source: Company, Angel Research
0
200
400
600
800
1000
1200
1400
Feb-18
Mar-18
Apr-18
May-18
Jun-18
Jul-18
Aug-18
Sep-18
Oct-18
Nov-18
Dec-18
Jan-19
Feb-19

14
Error!
Refer
ence
sourc
Angel Top Picks | February 2019
February 5, 2019
14
Research Team Tel: 022 - 39357800 E-mail: [email protected] Website: www.angelbroking.com
DISCLAIMER
Angel Broking Limited (hereinafter referred to as “Angel”) is a registered Member of National Stock Exchange of India Limited, Bombay
Stock Exchange Limited, Metropolitan Stock Exchange Limited, Multi Commodity Exchange of India Ltd and National Commodity &
Derivatives Exchange Ltd It is also registered as a Depository Participant with CDSL and Portfolio Manager and Investment Adviser with
SEBI. It also has registration with AMFI as a Mutual Fund Distributor. Angel Broking Limited is a registered entity with SEBI for Research
Analyst in terms of SEBI (Research Analyst) Regulations, 2014 vide registration number INH000000164. Angel or its associates has not
been debarred/ suspended by SEBI or any other regulatory authority for accessing /dealing in securities Market. Angel or its
associates/analyst has not received any compensation / managed or co-managed public offering of securities of the company covered
by Analyst during the past twelve months.
This document is solely for the personal information of the recipient, and must not be singularly used as the basis of any investment
decision. Nothing in this document should be construed as investment or financial advice. Each recipient of this document should
make such investigations as they deem necessary to arrive at an independent evaluation of an investment in the securities of the
companies referred to in this document (including the merits and risks involved), and should consult their own advisors to determine
the merits and risks of such an investment.
Reports based on technical and derivative analysis center on studying charts of a stock's price movement, outstanding positions and
trading volume, as opposed to focusing on a company's fundamentals and, as such, may not match with a report on a company's
fundamentals. Investors are advised to refer the Fundamental and Technical Research Reports available on our website to evaluate the
contrary view, if any
The information in this document has been printed on the basis of publicly available information, internal data and other reliable
sources believed to be true, but we do not represent that it is accurate or complete and it should not be relied on as such, as this
document is for general guidance only. Angel Broking Limited or any of its affiliates/ group companies shall not be in any way
responsible for any loss or damage that may arise to any person from any inadvertent error in the information contained in this report.
Angel Broking Limited has not independently verified all the information contained within this document. Accordingly, we cannot testify,
nor make any representation or warranty, express or implied, to the accuracy, contents or data contained within this document. While
Angel Broking Limited endeavors to update on a reasonable basis the information discussed in this material, there may be regulatory,
compliance, or other reasons that prevent us from doing so.
This document is being supplied to you solely for your information, and its contents, information or data may not be reproduced,
redistributed or passed on, directly or indirectly.
Neither Angel Broking Limited, nor its directors, employees or affiliates shall be liable for any loss or damage that may arise from or in
connection with the use of this information.
Disclosure of Interest Statement
Top Picks
1. Financial interest of research analyst or Angel or his Associate or his relative
No
2. Ownership of 1% or more of the stock by research analyst or Angel or associates or
relatives
No
3. Served as an officer, director or employee of the company covered under Research
No
4. Broking relationship with company covered under Research
No
Ratings (Based on expected returns Buy (> 15%) Accumulate (5% to 15%) Neutral (-5 to 5%)
over 12 months investment period): Reduce (-5% to -15%) Sell (< -15)